Saturday, April 9, 2011

GDP and Latitude!

Apparently, there's some correlation between Latitude and GDP. I found out about this recently, and I don't think I've ever posted my results up here (potentially since the results were disheartening).

Anyways, it wasn't hard at all. It's a lot of data-pulling though: CountryData, CityData to get the results.

Method!

Make a Module so you can repeat this process several times for all the countries--I love how computers can be such assiduous workers. Macs are by far more reliable though, compared to PC's that can get corrupted or burn out easily. Anyways, I confess I digress; moving on!

In the Module, you'll want to access the "CapitalCity" and "Latitude" of the given country, as well as the "GDPPerCapita" of the desired country.

Following that, make a List with 'x' as "Latitude" and 'y' as "GDPPerCapita".

Now, you might also want to use Tooltip so that you can identify each point on a ListPlot by simply hovering your cursor over it! Fantastic stuff!

Run the Module through several times for all countries, filter (using Select to take only the countries with two valid numerical data in their coordinates).

As always, I didn't reveal my whole code, but just the underpinnings and if you really want to know the code I used, email me! I believe it's somewhere on my Blogger Profile.


The data isn't so exciting, huh. It's kind of parabolic, but still disheartening, in both results and the fact that the great majority of the world are of Nixon's "Silent Majority"--unable to raise their voices, oppressed, and stuck in a cycle of poverty. Most countries (more than half) are below even 15000 GDP Per Capita.

Monday, January 31, 2011

The Great Return!

Hey all,

I'm back from a hiatus, working on Image Processing (SR 205) under James Choi again, hoping to get a shot at a week-long internship/volunteer program under Dr. Konopka, neurologist, in Chicago during the summer. This will, again, be a record of my endeavors, the first of which will be a map-solving algorithm, which Wolfram blog introduced, and which I want to develop into simpler code for many mazes. We'll see where I end up, and if I fail or find something more interesting, I might just move on!

Vamonos!

Thursday, December 2, 2010

Zipf Exploration Part II

Hi all,

Just a quick second edition to the original Zipf Exploration (below, or click the title).

I redid the code this time in order to minimize uncertainties. Specifically, I removed as many forms of punctuation as I could:

, . ! " ' ; : ? -

using a terrific combo of StringPosition, StringDrop, and Map. I got the position of all the above punctuation marks in Homer's The Iliad using StringPosition which takes two parameters, one for the foundation text, the other for the snippets to remove (you can have multiple on your "hit list," just make sure they're in String format and comma-delimited). Afterwards, use a While loop to subtract its position in the list (Java form) since when you start deleting the punctuation marks in the text, the character's spot is jerked back one. For example, the second value in your position list (I called them targets) is going to be wrong when you delete the first comma, for example. Thus, you need to subtract 1 from the second value, 2 from the third value, and so on). Then, another While loop in order to remove all the punctuation marks!

That should take care of a whole bunch of the boogers, but we still have the problem of case-sensitivity! So you gotta use ToUpperCase (or ToLowerCase if you so prefer) so you can have a very uniform word count). And the rest is basics, which I don't want to re-explain, so check out the initial Zipf Exploration post if you're interested.

BTW, here's The Iliad's breakdown:


Top-ranked words: {THE, AND, OF, TO, HE, HIS, IN, HIM, YOU, A, WITH, THAT, FOR, AS, I}

Sunday, October 24, 2010

Zipf Exploration

During my Wikipedia trawling, I found this very very cool concept made by a linguist, Mr. Zipf. He related the probability of a word's frequency as a function of its popularity ranking in any corpus of text. Think about that. I've given it a very unassuming definition, but it's ridiculous to think of how a simple discrete ranking (e.g. 1st most popular, 2nd most popular) can take into account a word's frequency of usage (e.g. 0.10823 probability of running into word X).

Just goes to show the deep roots between Numbers and Letters!

Anyways, so I was pretty psyched, so I figured to do some Mathematicking and constructed a graph and module to compare the differences between the expected frequency of a word and the actual frequency of a word in various corpora of the ages.


First, I'll go over the code!:

1) Find a plain text or html file of the whole corpus (must be large) to be tested. I used Aeschylus' The Eumenides and Stevenson's Treasure Island. I found them via OTA, the Oxford Text Archive.

2) Import into Mathematica the whole file.

3) Separate each word so they're individual elements of one list, using StringSeparate.

4) Tally the list, SortBy the Last element, then finally Reverse it to get the most frequent word on top of the list rather than at bottom, just to satiate your burning desires of which word is most frequent. I'll allow you to figure what word would be most common.

MODULE:
We want to make a ListPlot of the differences in probability of running into any word, as a function of its popularity ranking. Luckily, Mathematica's ListPlot will automatically number each entry in a uni-level list so we can just worry about getting the probabilities for both Zipf's expected values and the Author's actual values.

5) Form two empty lists, expectedValList and actualValListListPlot.

Make a Module which takes one parameter rank_.

The Module will Append the Zipf's expected probability, calculated by:


where is the usage ranking (popularity of use in the corpus) and is the number of individual words in the corpus

to the expectedValList and we Append the actual probability of running into the word:


where is the number of times the word is repeated and is the number of words in the corpus

to the actualValList.

DATA:

6) Now run a While loop for however many top words you want to compare Zipf's expectations to, and...

PLOT:

7) Now it's a matter of ListPlot!

RESULTS:

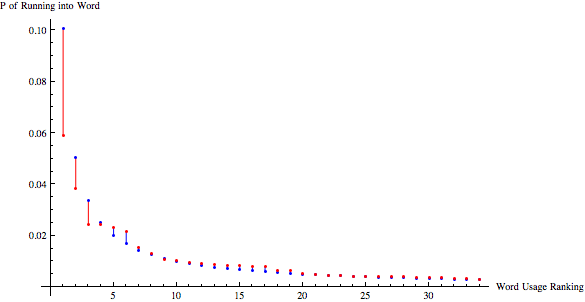
A comparison of Stevenson's frequency of word choice (red) and Zipf's expected frequency of word choice (blue). This is for Treasure Island.

Words in Rank: {the, and, a, of, I, to, was, in, had, he, that, his, with, my, as, you, for, on, it, at, we, but, not, were, me, by, have, all, said, be, this, one, from, so, out}


Similar graph for Aeschylus' The Eumenides:


Words in Rank: {the, to, of, a, in, and, I, you, my, your, this, for, with, all, his, on, CHORUS, our, who, that, LEADER, no, from, is, by, will, he, as, You, not, we, those, their, ATHENA, have}

UNCERTAINTIES:
There are quite a few discrepancies in the Aeschylus Zipf comparison, compared to Stevenson Zipf comparison. I'm assuming this is because it was translated from Greek, and thus not applicable to English, even though written in English syntax. Also, the code I've written does not account for discrepancies in punctuation, so the counts may be off, but I wouldn't believe it to significantly affect the count. The discrepancies get noticeably less with each ranking increase, percentage-wise.

Tuesday, July 6, 2010

EKG File Processing

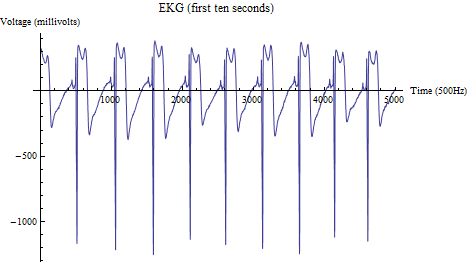
I got an EKG file from Dr. Konopka via Dr. Choi and, with it, I was to chart the change in heart rate. The patient was administered a drug which would elevate heart rate and the EKG lasted for around 5 minutes. Anyways, the easiest way I thought of to process the file was to use an If statement nested in a For loop to check if a point passed a certain threshold value (I used the refractory period to be around the point at which I counted it as a "beat" which I determined to be anything below -800). Seeing that the SA node doesn't shoot another action potential until around 500 data points later (the EKG file was take at 500Hz, so that means, about one electric signal from SA node per second), I stayed on the safe side and incremented the i value (my For loop counter) by 400. That being done, I then incremented my count value which counts the number of beats. The rest was easy-peasy: multiply count by (60/period specified by user in param).

The EKG:


First Channel:


Second Channel:


Indeed, there is a definite positive slope, so the drug, at least for those five minutes, elevated heart rate.

By the way, the graphs above, although for two different channels, have the exact same output of: {55,57,58,60,62} in regards to BPM.

Monday, April 5, 2010

Cellular Automaton Part II

Well! It kind of worked!

My algorithm actually acted like dandelions! Heh. This is just the start.

I put a limit on how much the dandelions could cluster before I reassigned that grid box as zero (1 <= dandelion < 3). Wonderful!

Images:


PS. I understand there is some kind of function in Mathematica for making CA. By the time I found out, I had already coded most of my CA and didn't want to change so I just went along with my code. Plus, this is a much more enlightening experience than just writing: CellularAutomaton[...].

Thursday, April 1, 2010

Cellular Automaton Part I

I've been working on cellular automata and have been miserably failing.

I'm trying to do what I thought to be a "basic" automaton (I'm going to abbreviate to ca).

The basic ca runs as such:
1. Dandelions live for one step
2. Dandelions spread their seeds in the grid square right above, to the right, to the left, and below. We record this data in a list where each dandelion is any number greater than one. Spreading seeds is modeled by incrementing each "seeded" square's number by one.
3. The dandelion that spread its seeds dies by decrementing one. If there was a "cluster" of dandelions, then the decrement simply decrements the cluster down one.
4. Update and go back up to step one.

This "basic" code turned out to be much more challenging than I had thought.

I actually coded all the statements to randomly seed dandelions with 1/16 probability (get random integer from 0-15 and choose say 1 to indicate presence of dandelion). Then, I used a for loop to evaluate the inner boxes (all the boxes not on the outer edges) to avoid complications and ugly coding I really didn't want to do until I knew my algorithm as a whole worked well (which it, unfortunately, didn't). The body of the for loop was relatively simple: if the grid box it's evaluating at that moment has a value greater than or equal to one, then increment the boxes around it by one. Else, give it a value of zero, and move on.

Well, the result? The dandelions proliferated in far greater numbers than even GM dandelions on steroids would have reproduced... In essence, the grid was completely yellow. Not a speck of green. Why? Well, I didn't put a check on how much the dandelions could cluster before they died. So squares could accumulate massive numbers and no matter how many times it was decremented, it was simply incremented up at chaotic values.


And, well, the complete yellow one is just a waste of space.

<4/5/10: I actually fixed the code. Look one post after, labelled Cellular Automaton Part II>